Technical analysis is used by traders and analysts to predict the future behaviour of financial assets prices. Essentially, it looks back at prices of an asset in the past and utilizes that price data to determine how the asset price will behave in the future. It is based on the assumption that it is possible to discern patterns in the way future prices move as history repeats itself.
80% of retail investor accounts lose money when trading CFDs with this provider. You should consider whether you can afford to take the high risk of losing your money.
The determination of future price movements is based on finding recognizable patterns. Once the pattern is recognized, given similar circumstances it is possible to predict with reasonable accuracy the future behaviour of the price. Technical analysis tends to focus on the following patterns:
The price trend is the general direction of the price over a substantial period of time. This direction can be either bullish (upward direction) or bearish (falling prices). Most traders prefer to trade with the direction of the price trend and not to trade against it.
Support and resistance are points where the trend tends to reverse. Support is a point where price stops its downward trend, while resistance stops the price from continuing its upward trend.
An overbought condition occurs when an asset is overvalued and its price is expected to decrease. An oversold condition is the opposite situation where the asset is undervalued and its price is expected to increase.
Volume is used to confirm trends and price patterns. The higher the volume, the stronger the trend or pattern is.
To facilitate the analysis of the markets, the technical analyst relies on a variety of indicators. Here are the most popular, commonly used indicators:
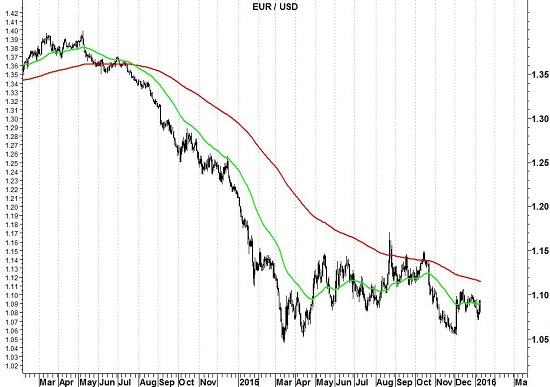
The moving average or MA is used to help smooth out minor price movements in order to provide a clearer picture of the price trend. The time frame of the MA varies from 5, 10 or 20 days, to longer periods of 50, 100 and even 200 days. The following EUR/USD chart has two moving average lines.
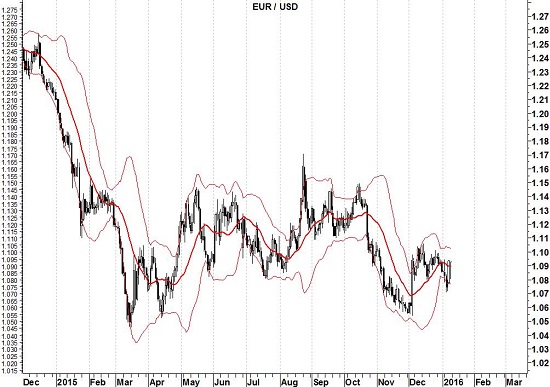
The Bollinger Bands indicator is created by using a simple moving average with 2 standard deviation lines plotted above and below it. The bands expand and contract with changes in the volatility. It is used to determine overbought and oversold market conditions.
You can see an example of Bollinger Bands on a EURUSD chart below.
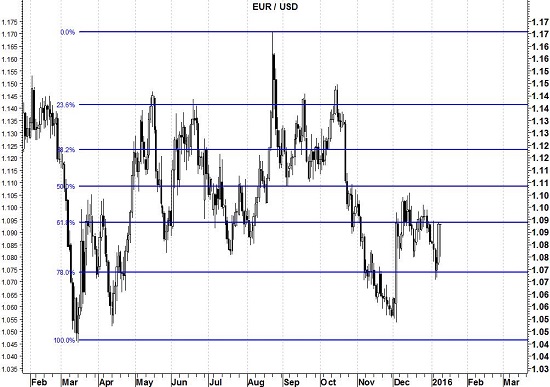
Based on naturally occurring ratios (23.6%, 38.2%, 50%, 61.8%, 100%), the Fibonacci Retracement levels are used by traders to determine possible support and resistance levels.
Here is an example of Fibonacci retracement lines depicted on a EUR/USD chart.
The MACD or Moving average convergence divergence is a momentum indicator that is based on the relationship between shorter period and longer period exponential moving averages. It is used by traders to trigger a buy or sell signal.
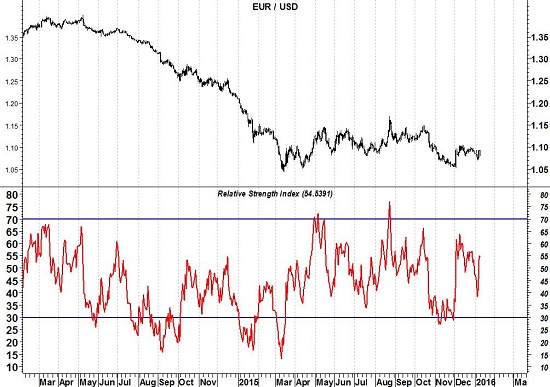
The Relative Strength Index or RSI was developed by J. Welles Wilder Jr and is a momentum oscillator. It helps traders identify whether the market is overbought or oversold by comparing the scope of recent losses and profits. An RSI value of 70 and up is an indication of an overbought condition while an RSI value of 30 and down is an indication of an oversold condition.
Here is how the RSI will look like on a EUR/USD chart.
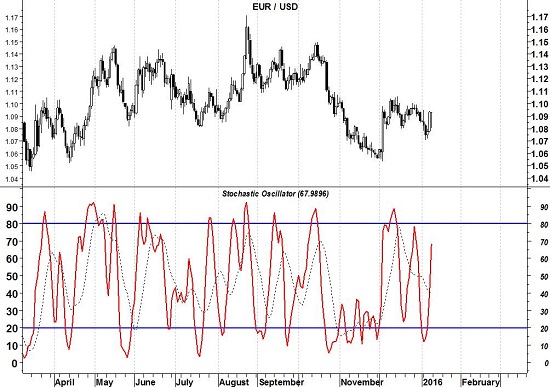
The Stochastic oscillator compares an asset’s closing price to its overall price range for a given time frame, in order to determine overbought and oversold market conditions. The default time frame for the calculation is 14 periods. The value of this indicator ranges from 0 to 100. An overbought situation is indicated in a value of 80 and above, while an oversold situation is indicated in a value of 20 and below.
Here is an example of Stochastic oscillator in a EURUSD chart.
80% of retail investor accounts lose money when trading CFDs with this provider. You should consider whether you can afford to take the high risk of losing your money.